Data Centers / Evidence Guide

An evidence guide for local communities

Data centers are large. Their local effects are not simple.

A concise guide to what recent research can tell us about jobs, firms, housing, public revenue, and electricity prices - and what remains unresolved.

4.4% Share of US electricity used by data centers in 2023. Source: US Department of Energy.
$1B+ Typical capital cost of a hyperscale campus. The investment is physically large and highly localized.
Dozens Typical on-site workforce after construction, rather than the thousands employed by a large manufacturing plant.
Start here

Ask a question about data centers.

This early search tool retrieves short, prewritten summaries from the studies included below. It does not generate new claims.

Guided search beta

What would you like to know?

Try a plain-language question. Each answer identifies disagreements and links back to the underlying research.

01 / The basics

Not all data centers are the same.

The label covers different ownership models and generations of technology. Those distinctions matter when applying historical evidence to a proposed project.

Owner-operated

Hyperscale

A large cloud provider builds or controls the campus for its own network. These facilities can draw hundreds of megawatts, but ongoing on-site employment is modest.

Watch: capital scale, construction, grid demand
Shared infrastructure

Colocation

An operator leases space, power, and connectivity to many customers. The tenants' engineers and business teams need not work in the host community.

Watch: tenant mix, utilization, local staffing
New generation

AI-era campus

GPU-heavy campuses are larger and more power-dense than much of the cloud-era sample. Most are too recent for credible estimates of long-run local effects.

Watch: scale, timing, extrapolation risk

Site selection

Power, fiber, land, permitting, and tax terms shape where projects go.

Construction

Land clears, lights rise, and specialized construction activity begins.

Operation

Servers run continuously, while the permanent on-site workforce remains small.

Local incidence

Taxes, utility investment, housing, and nearby business activity may adjust.

02 / Our findings

A large physical investment. No broad local economic response.

Bahar and Wright begin with a registry of 341 hyperscale facilities and combine satellite-based construction timing with within-site rings, 84 announced projects that were not built, and county panels. Outcome samples vary with data availability, but a common-site check produces the same qualitative pattern. The clearest findings are a sharply localized physical footprint and narrow bounds on advertised salaries and firm entry.

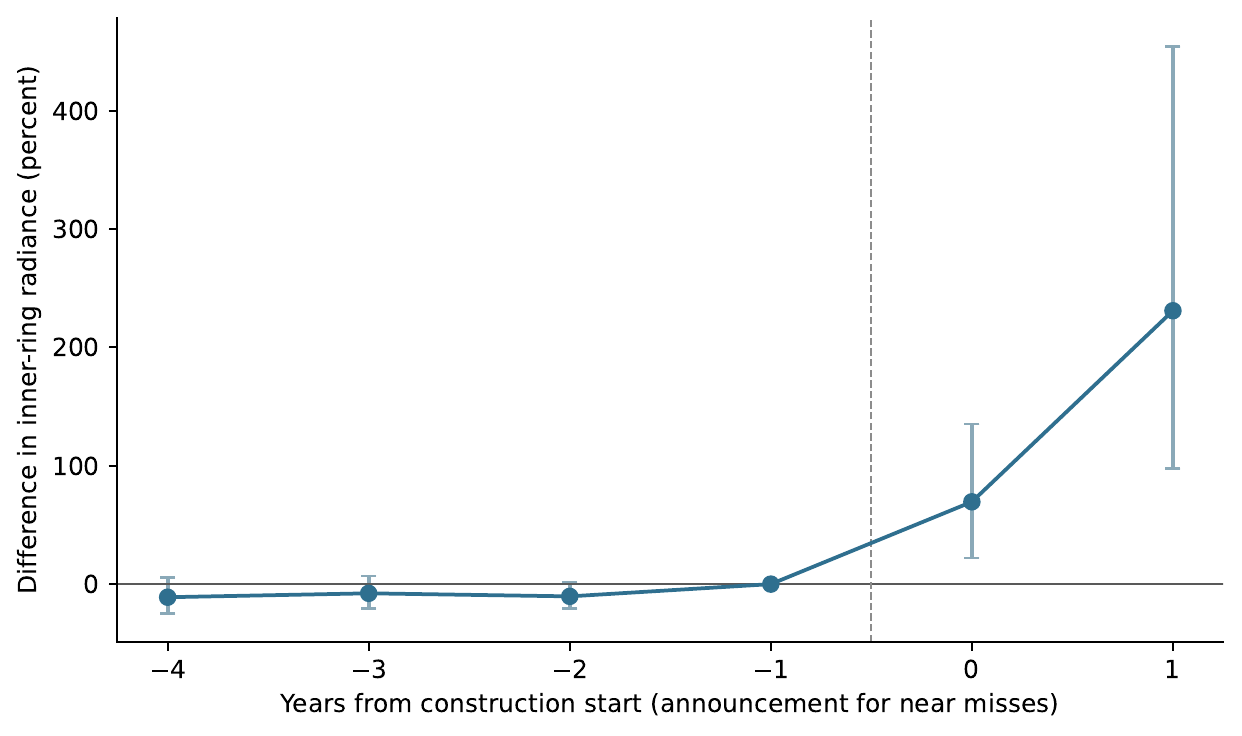
Event study showing the radiance difference between completed and near-miss sites flat before construction, then rising 70 percent in the construction year.
Completed sites versus announced projects that were not built. Among 43 isolated built sites and 49 isolated near misses, radiance at completed sites rises 70% relative to near misses in the construction year; near-miss sites show no increase. The paper's within-site log(1 + radiance) estimate is +38%, with a 95% interval of +15% to +71%. The difference reflects the outcome transformation, not the comparison group.
+38%

Nighttime radiance within one kilometer when construction begins.

The change fades rapidly with distance and is near zero by five kilometers. Daytime imagery independently confirms land clearing at the same time.

Within-site estimate with site-specific pre-construction trends. 95% CI: +15% to +71%.
Narrow null

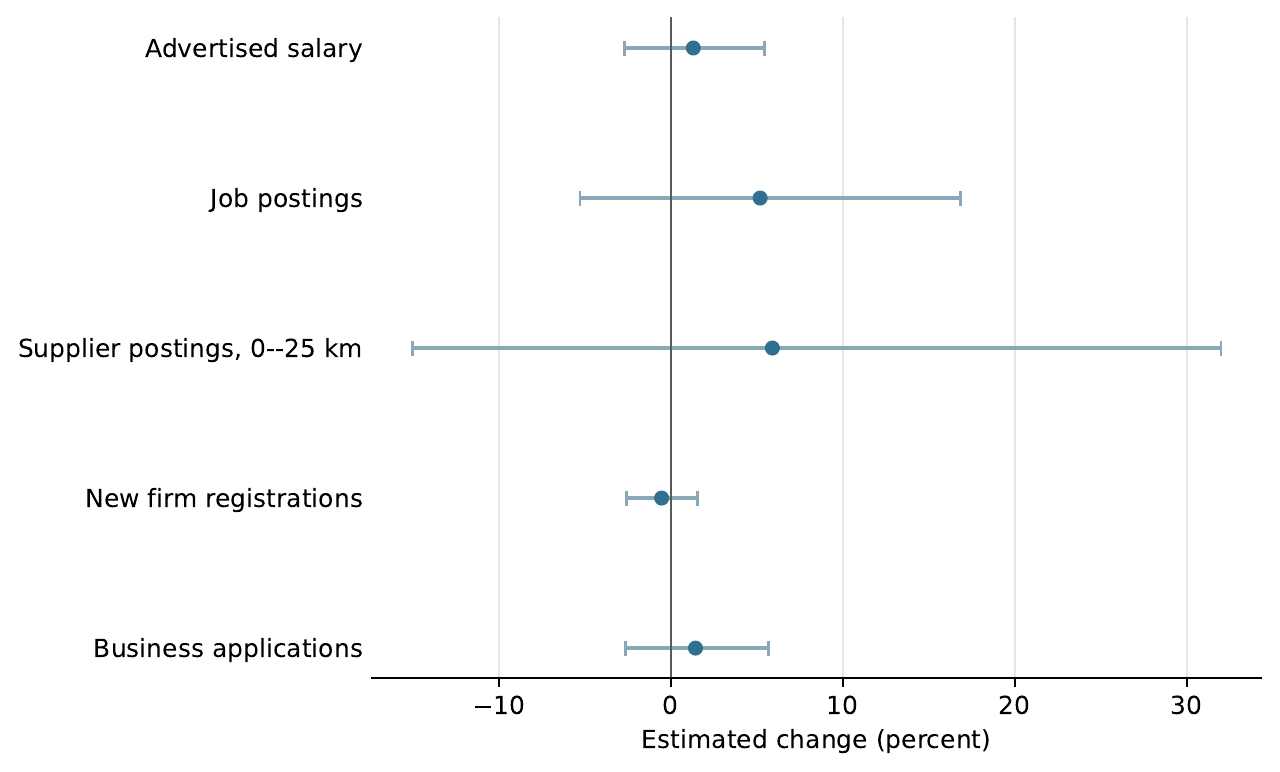
Advertised salaries

+1.3%

The 95% interval is -2.7% to +5.5%. The evidence rules out a large salary response in posted, mostly white-collar jobs.

Narrow null

New-firm registrations

-0.5%

The upper confidence bound is +1.6%. A national business-applications analysis produces the same qualitative result.

Less precise

Job postings

+5.2%

The 95% interval is -5.3% to +16.8%. This rules out increases above roughly 17% but allows modest gains and cannot isolate the facility's own hiring.

Inconclusive

Supplier activity

+5.9%

The 95% interval is -15.0% to +32.0%. The estimate does not establish whether local demand for supplier industries rises.

Suggestive

Rents and public revenue

+2% to +5% rents

Synthetic-control rent estimates are positive but imprecise. School property-tax revenue has a +16.6% point estimate, but it is not statistically distinguishable from zero after adjustment across six fiscal outcomes.

Historical null

Residential electricity rates

No increase

Average estimates range from -0.9% to -1.5% across comparisons and are imprecise. The sample does not cover the larger post-2022 AI build-out.

Near zero does not always mean precisely zero.

The figure shows preferred estimates and 95% confidence intervals. Salary and firm-entry intervals are narrow. Hiring and supplier intervals are much wider.

  • Narrow interval: stronger evidence against a large response.
  • Wide interval: absence of detection is not evidence of absence.
  • Zero line: no estimated change at opening.
Confidence interval plot with salary, new-firm registrations, and business applications close to zero, and wider intervals for job and supplier postings.
Preferred hyperscale agglomeration estimates from Bahar and Wright. Estimates are transformed from log points to percent.
03 / Interpretation

Why credible studies can reach different answers.

A result is always an answer to a particular question. Changing the geography, treatment, period, estimator, or outcome can change the estimand.

01

Geography

A one-kilometer ring measures something different from a county, commuting zone, utility territory, or wholesale power market.

02

Treatment

First opening, facility count, capacity, revenue growth, and proposed AI load are not interchangeable shocks.

03

Period

Cloud-era facilities provide a longer post-period. New AI campuses are larger but generally too recent for long-run evaluation.

04

Method

Within-site comparisons, shift-share instruments, utility event studies, and dispatch models rely on different assumptions.

05

Outcome

Data-processing employment and establishments can rise because the facility itself enters, even when related industries show no consistent response.

04 / Research guide

The emerging evidence is mixed, not empty.

These studies are complementary rather than directly comparable. The summaries below separate historical estimates from forward-looking power-market simulations.

Bahar & Wright
2026
Sub-county rings, announced near misses, county diagnostics
Large and localized construction footprint; no rise in advertised salaries or firm registrations; less precise hiring and supplier estimates; direct data-processing entry but no consistent growth in related industries.
Paper
Alvarez, Argente, Chow & Van Patten
2026
County-level shift-share IV using global data-center growth
Positive effects on employment, data-processing and construction activity, establishments, house prices, electricity prices, income, and wages at different horizons.
NBER
Meeks, Pless, Qi & Wang
2026
Facility entry linked to utility prices, investment, and rate cases
Average retail prices rise 2.7%, with larger effects at investor-owned utilities and in deregulated generation markets.
MIT
Kay, Reaser & Taylor
2026
Hourly unit-level least-cost dispatch model
Existing data centers raise modeled wholesale prices by 3% to 5%; projections vary sharply with utilization and build-out assumptions.
Dallas Fed
Watten, Bistline & Blanford
2026
Historical retail-rate IV, 2015-2024
Modest historical retail-price reductions, consistent with economies of scale; future supply constraints could reverse the effect.
Paper
05 / Bottom line

Four conclusions that survive the disagreement.

01

The capital footprint is real and local.

Construction transforms the parcel. Satellite measures make that timing and spatial concentration visible.

02

Capital scale does not guarantee a broad local multiplier.

Direct data-processing activity can increase without creating a technology ecosystem around the site.

03

Electricity incidence depends on institutions and constraints.

Wholesale markets, utility ownership, rate regulation, investment timing, and spare capacity all matter.

04

The AI build-out remains an open empirical question.

The newest campuses are larger and more power-intensive. Historical evidence should inform the debate, not end it.